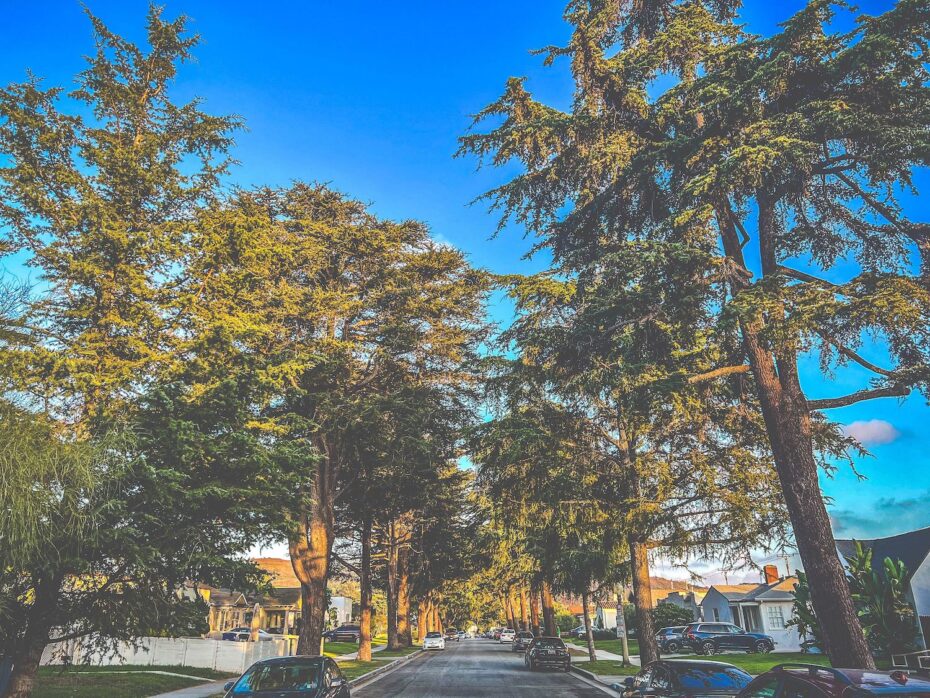
Four California Cities Lead The Nation In Most Expensive Price Per Square Foot

“Size does matter,” they used to say. But in the real estate dance of the last few decades, it’s the price per square foot that’s tangoing its way into the spotlight. The U.S. real estate market, in its infinite wisdom (or lack thereof), has found yet another way to pull the rug out from under prospective homeowners.
Newly released data from Clever, a real estate data firm, reveals that the median sale price per square foot for new single-family homes in the U.S. has risen by an eye-watering 368% since 1980. Now, if you’re rubbing your eyes thinking you read a typo, trust me, you’re not alone. The zeros are all in the right place.
The Generational Footprint: Millennial Woes and Boomer Bargains
The dance continues: U.S. homes have become roomier, expanding by 52% in square footage since 1980. But hold onto your wallets – the median sale price has skyrocketed by a staggering 609% in that time. In short? We’re shelling out over a thousand percent more per cozy square foot. Comforting, isn’t it?
Generational wars are nothing new, but in the real estate arena, millennials draw the short straw. Entering their 30s in 2022, they faced a whopping 161% higher median sale price per square foot than their boomer counterparts at the same age. Yes, while boomers were rocking out to The Rolling Stones, they were also getting some sweet real estate deals.
Remember the 2008 financial crisis? Those were simpler times (well, not really). Compare that era to today, and you’ll find that home buyers now face an 85% higher median sale price per square foot. Seems like the real crisis was just getting started.
Coast to Coast Comparisons: From Sky-High San Jose to Cost-Conscious Cleveland
And in the parade of pricey places to lay your hat? California. It wears its gold medal with pride, and San Jose takes the cake at a median of $845 per square foot. In fact, the top five is dominated by four California cities, with New York City securing the 5th place on the list.
- San Jose ($845)
- San Francisco ($705)
- Los Angeles ($641)
- San Diego ($587)
- New York ($490)
For the budget-conscious, Cleveland offers a bit more breathing room at a mere $133 per square foot. And before you ask, yes, when adjusting for inflation, new single-family homes have seen an increase of 32% since 1980, which paints an interesting picture.
From 2018’s vantage point, Tampa enjoyed the limelight with the most significant spike in price per square foot (72%), while Baltimore gave a modest nod with the smallest (13%). But who’s leading the pack? San Jose, San Francisco, and Los Angeles top the list, with Cleveland and Memphis at the other end.
Intriguingly, in the past half-decade, Providence, Rhode Island, added a little elbow room, seeing the most significant increase in median square footage. In contrast, Charlotte, North Carolina, seemingly took some off the top, with a 21.6% decrease.
In the square footage shuffle, while space might be expanding or contracting, one thing’s for sure: our wallets are feeling the pinch. And as the real estate market dances on, one can’t help but wonder: is the floor going to drop out from under us, or are we just warming up? Only time will tell.