
Thanks to low interest rates and high demand fueled by the pandemic, the housing market across the U.S. has been on absolute fire over the past 12 months. This increase in demand has also driven home values through the roof. So much so that home values in the U.S. are up a combined total of $1.9 trillion since March of 2020.
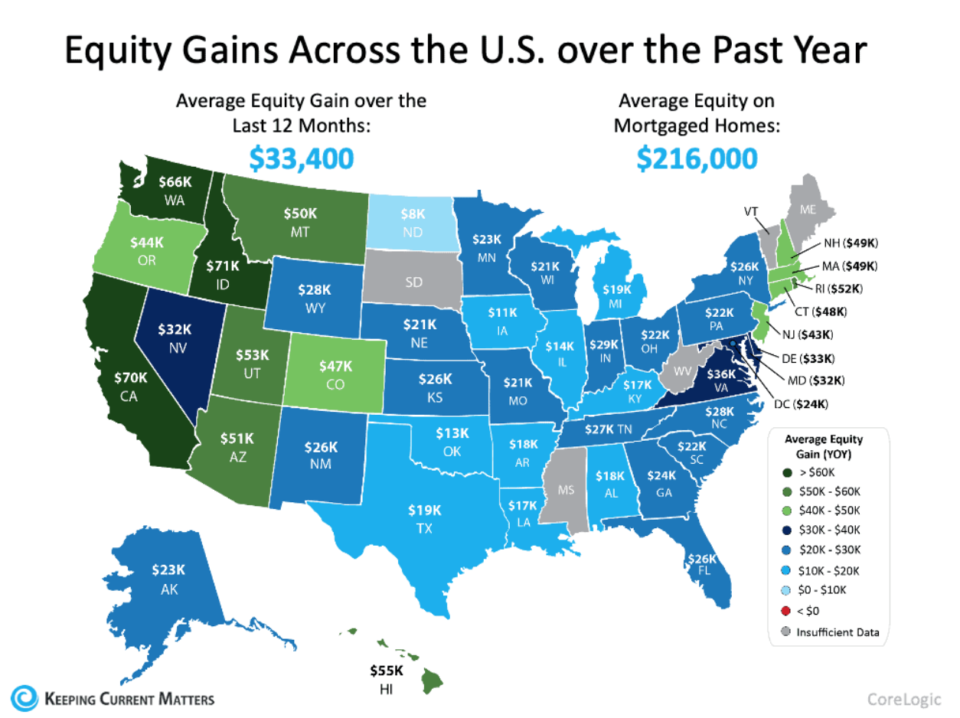
According to a report from CoreLogic, the average homeowner gained $33,400 in equity from Q1 2020 to Q1 2021. The increase, in some instances, is even greater. At times, it’s been enough to turn a happy homeowner into a seller.
Home Equity Increase By State Over The Past Year
Per the report, home equity increase was greatest in Idaho, California, and Washington. They experienced gains at $70,900, $69,600 and $65,800 respectively. Meanwhile, Iowa and North Dakota experienced the lowest average equity gain in the first quarter of 2021 at $17,000 and $8,400 respectfully.
The map below shows a breakout, by state of the average equity gain over the past year.
The Value Of Your Home Has Increased, Now What?
If you’re not looking to cash in on all that sweet, sweet equity, you can opt to refinance for a lower interest rate or you can even do a cash-out refi where you get some of that home equity in the form of cold, hard cash. That’s a great option if you want to deploy that money elsewhere and use it to make more money.
Read Next: 4 Best Real Estate Crowdfunding Sites For Non-Accredited Investors
Map via Keeping Current Matters by way of CoreLogic