Modern consumer spending has changed. Shifts in spending shares show that items once considered major financial burdens now take up a smaller share of the typical family budget. This approach highlights how gains in agricultural technology and global supply chains have altered the cost of basic goods.
Looking at the following percentages exposes not just changing prices, but a rewrite of our daily priorities and standard of living. Here are 17 Things That Take Up Far Less of Americans’ Budgets Than They Used To
1. Clothes
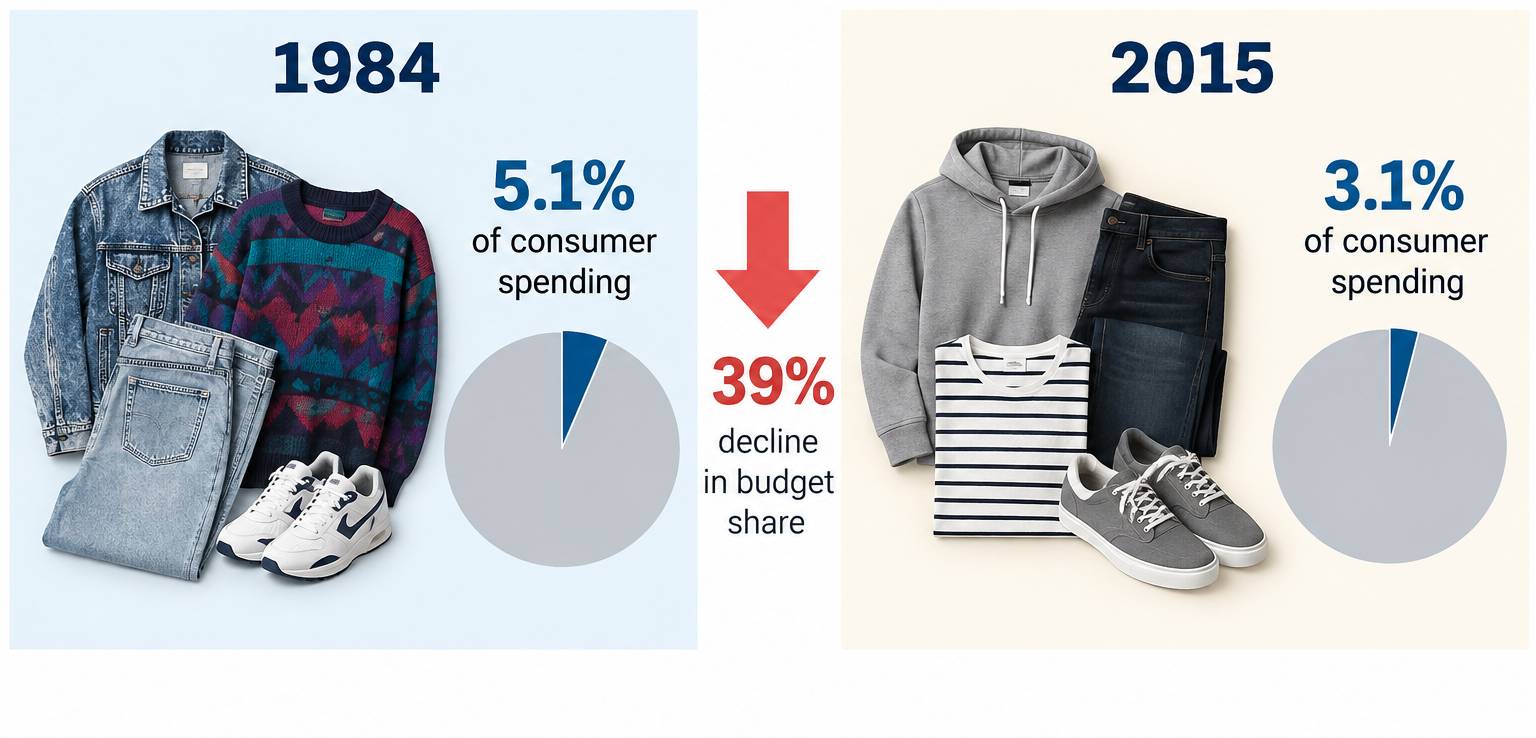
Clothes once took a large bite out of the typical American budget. Bureau of Labor Statistics data show clothes accounted for about 5.1% of urban consumer spending in 1984, compared with just 3.1% in 2015, a decline of 39% in its budget share.
2. Food Overall
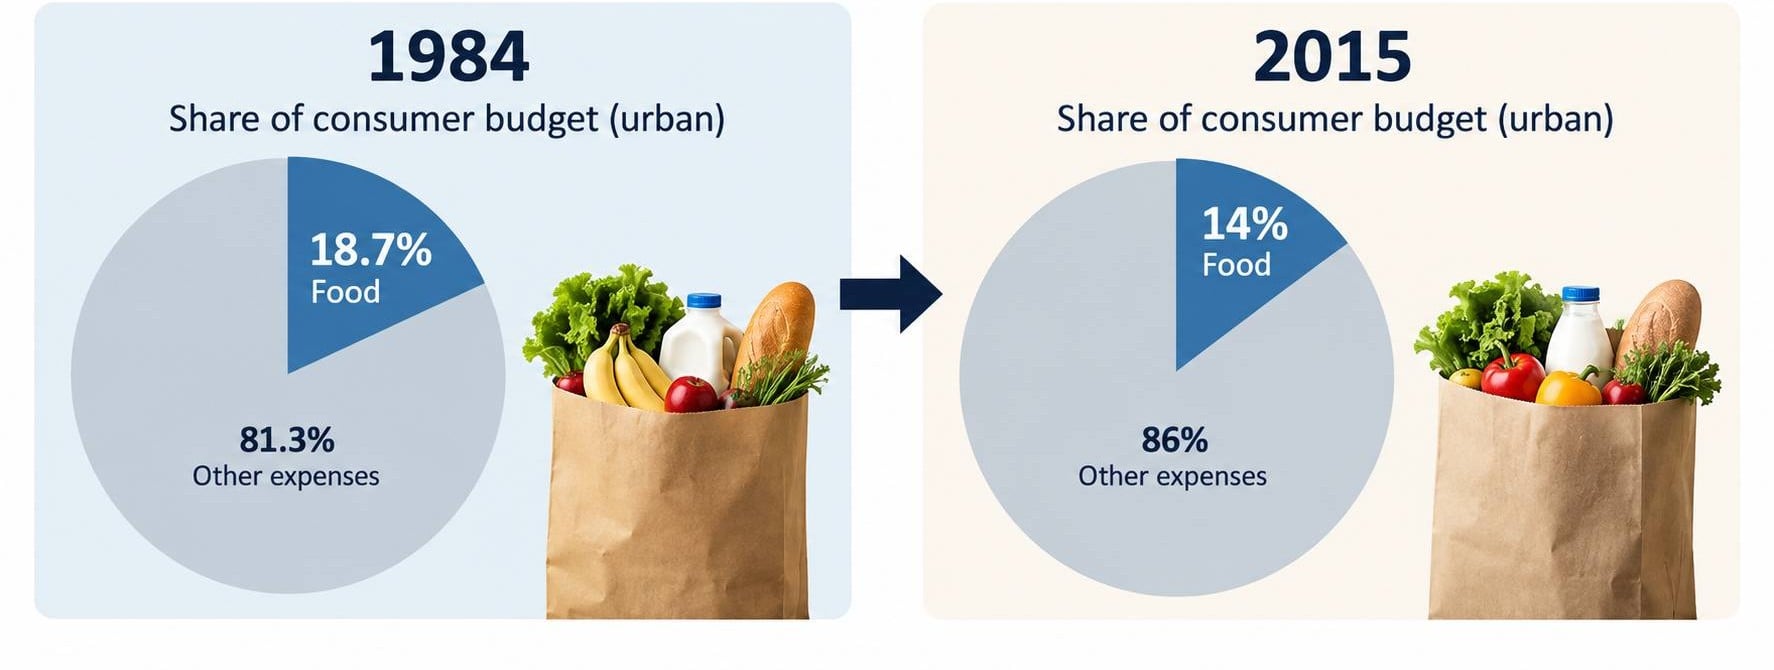
Food remains essential, but it occupies a smaller portion of the consumer dollar than it once did. Among urban consumers, food accounted for about 18.7% of the budget in 1984 versus 14% in 2015.
3. Groceries
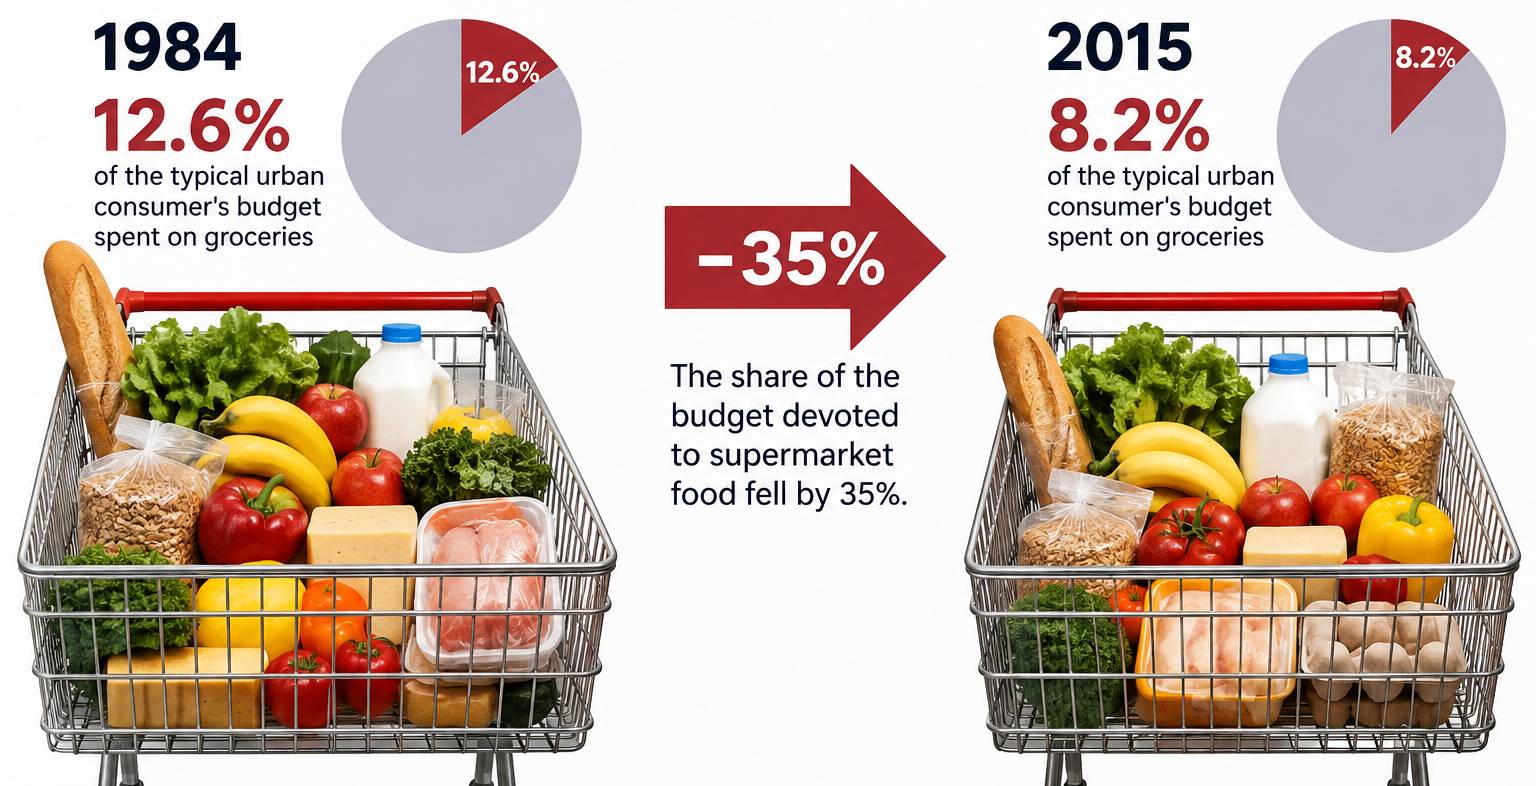
The decline is even clearer when looking only at food eaten at home. Groceries represented 12.6% of the typical urban consumer’s budget in 1984, but just 8.2% in 2015. In other words, the share of the budget devoted to supermarket food fell by 35 percentage points.
4. Meat, Poultry, Fish & Eggs
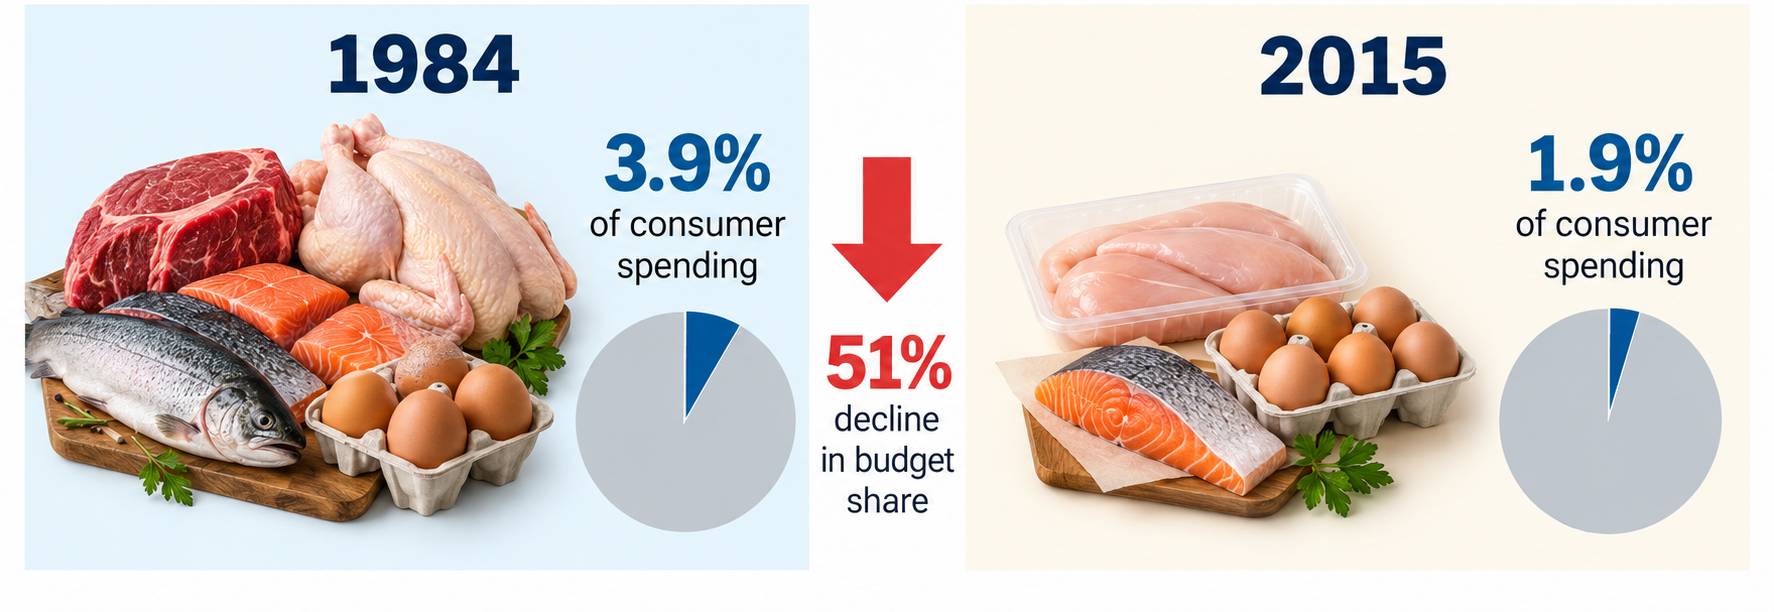
Protein staples once occupied a much larger portion of spending. Meat, fish, and eggs accounted for nearly 4% of the urban consumer budget in 1984, compared with about 1.9% in 2015. That represents a decline of more than half in this category’s share of spending.
5. Dairy Products
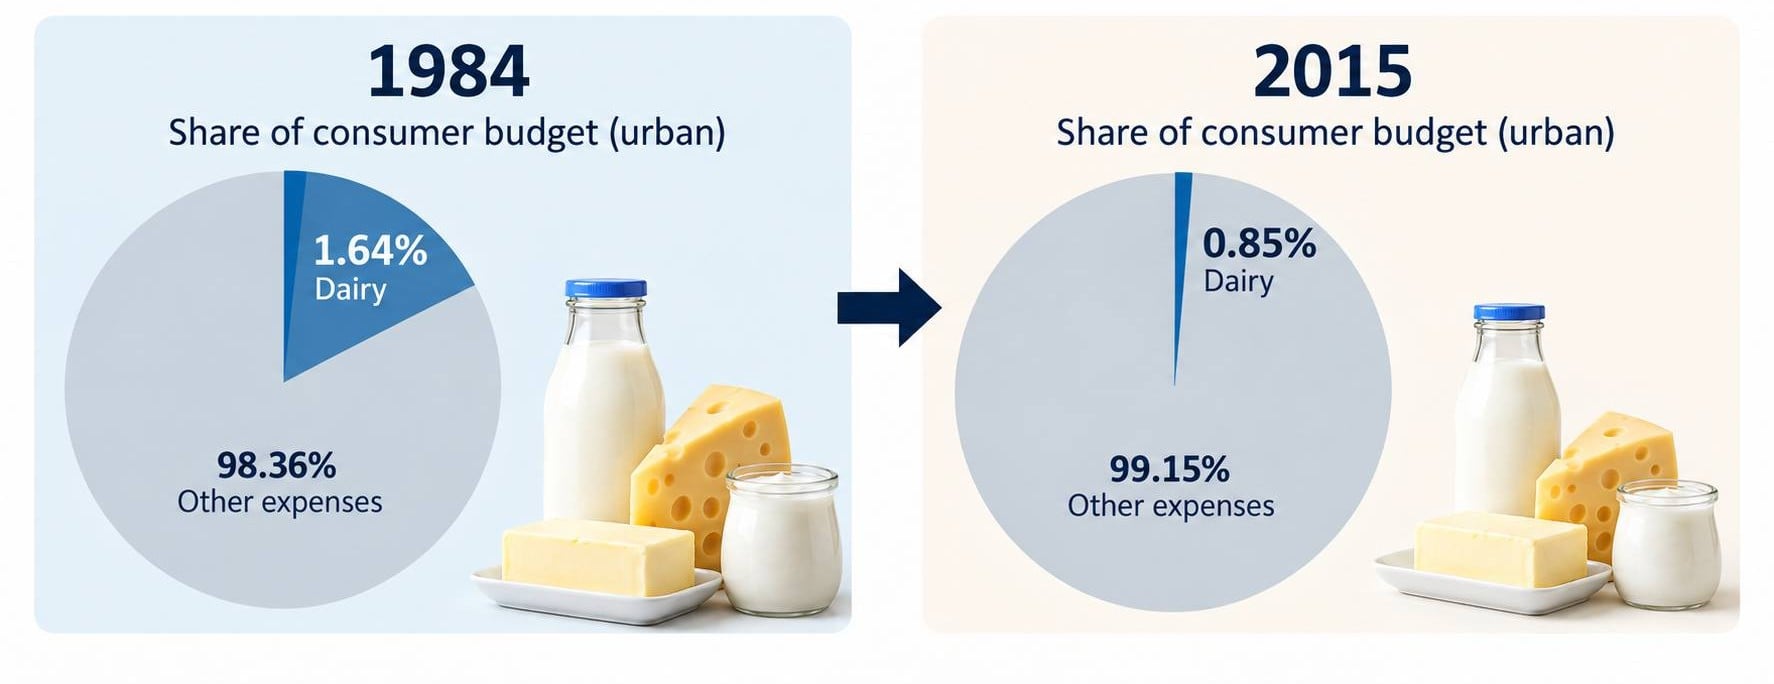
Milk, cheese, butter, and other products became a much smaller household expense relative to everything else consumers buy. Dairy fell from about 1.64% of the urban consumer budget in 1984 to 0.85% in 2015.
Trending on Wealth Gang


6. Bread & Bakery Products
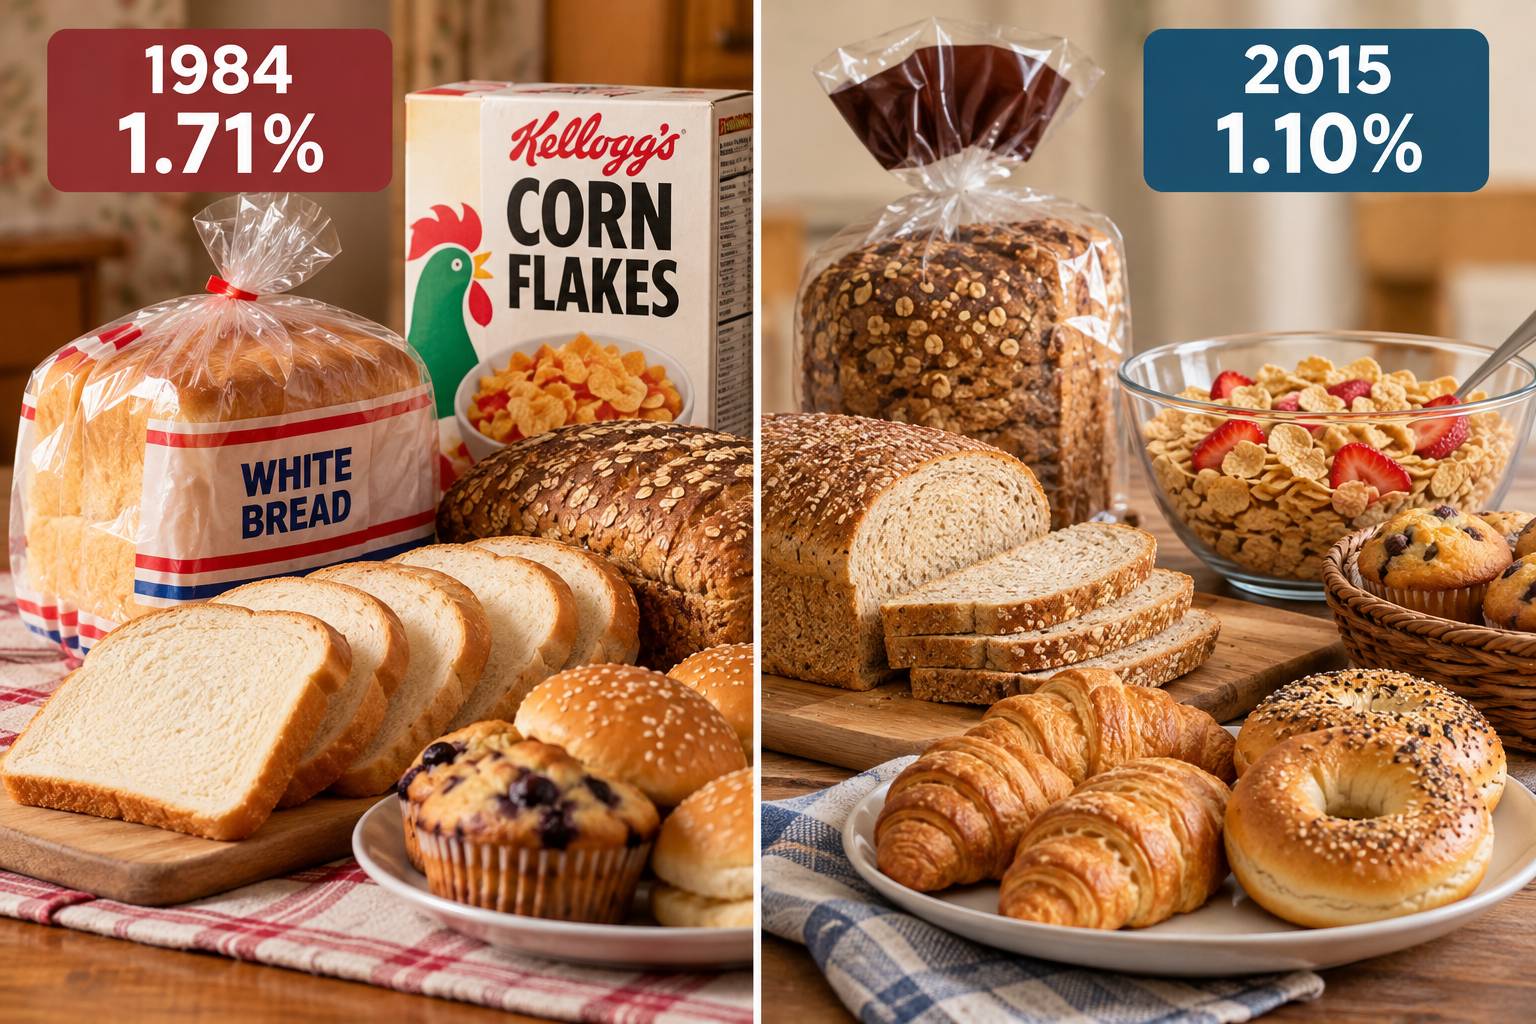
Bread and cereal remain kitchen staples, but they command less of the consumer dollar than they did several decades ago. Cereal and bakery products fell from about 1.71% of urban consumer spending in 1984 to 1.10% in 2015.
7. Fruits & Vegetables
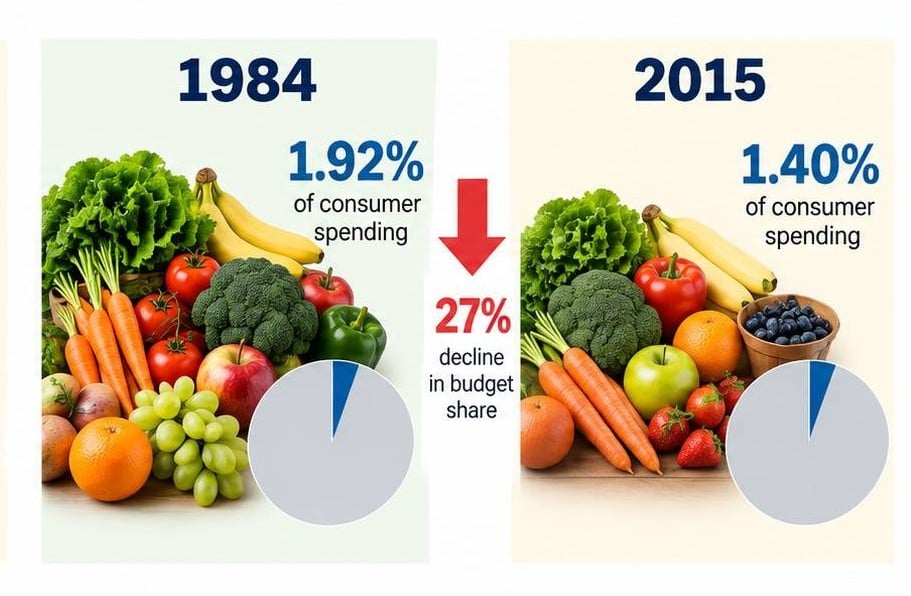
Their share of the typical urban consumer budget declined from about 1.92% in 1984 to 1.40% in 2015, a reduction of 27%.
8. Coffee, Soda & Juice
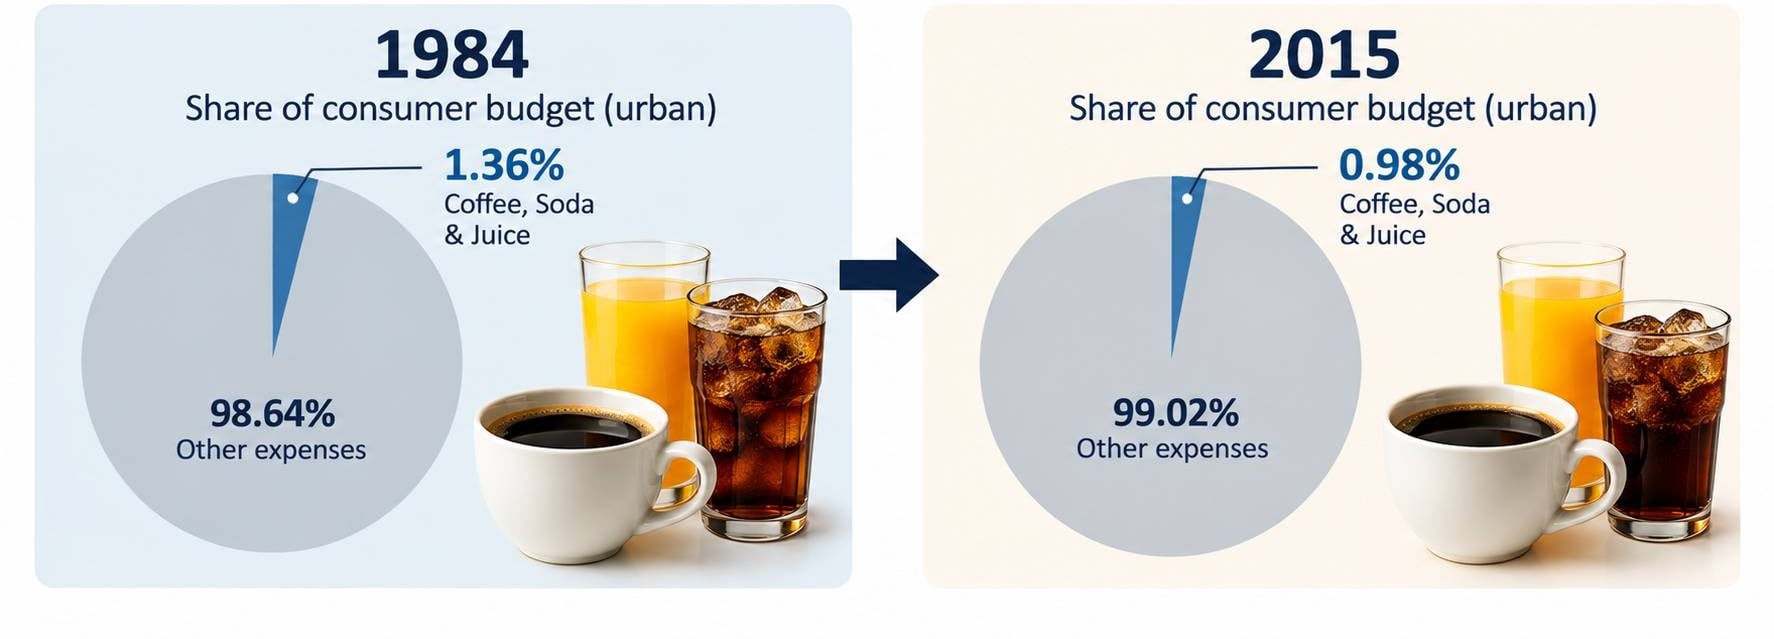
Non-alcoholic beverages also became a smaller part of the consumer budget. BLS data show the category declining from 1.36% of spending in 1984 to 0.98% in 2015 for urban consumers, a decrease of more than one-quarter in its budget share.
Sign up for our newsletter
9. Energy
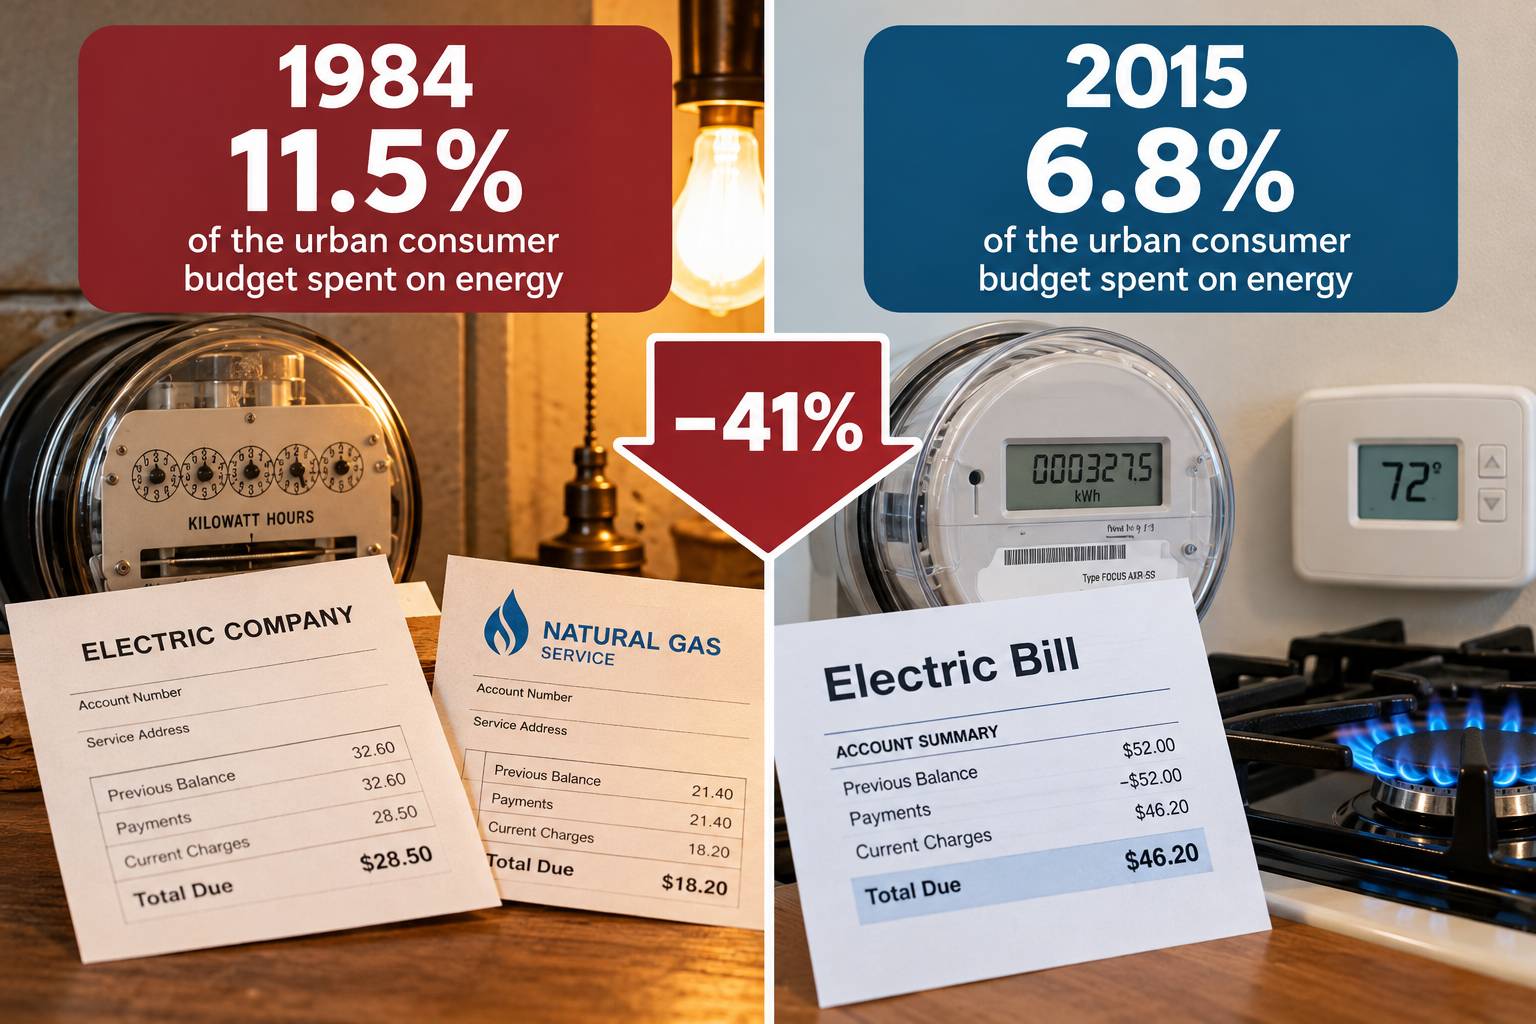
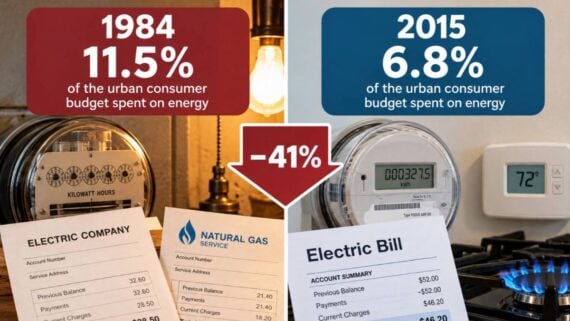
Energy once consumed a large part of Americans’ spending. For urban consumers, energy-related expenditures represented about 11.5% of the budget in 1984, compared with 6.8% in 2015.
10. Transportation
Cars remain expensive, but transportation once dominated an even larger portion of spending. In 2024, transportation accounted for about 17% of average Consumer Expenditure Survey spending.
11. Tobacco
Smoking used to command a greater share of consumer spending. In 2024, tobacco products and smoking supplies represented only about 0.4% of average expenditures.
12. Alcohol

Alcohol has also lost ground within the typical budget. By 2024, alcoholic beverages accounted for only about 0.8% of average household expenditure.
13. Reading Materials

Books, newspapers and magazines have become a tiny part of the average household budget. Reading materials lost budget share between 1984 and 2015, and by 2024 the broader reading category averaged only $125 per household.
14. Sporting Goods

Consumers today devote a smaller portion of their budgets to sporting goods than urban consumers did in the mid-1980s.
15. Personal Care Products

The portion of consumer spending devoted to traditional personal-care products and services, including toiletries, shaving products, cosmetics, and similar purchases, declined between 1984 and 2015.
16. Physical Goods
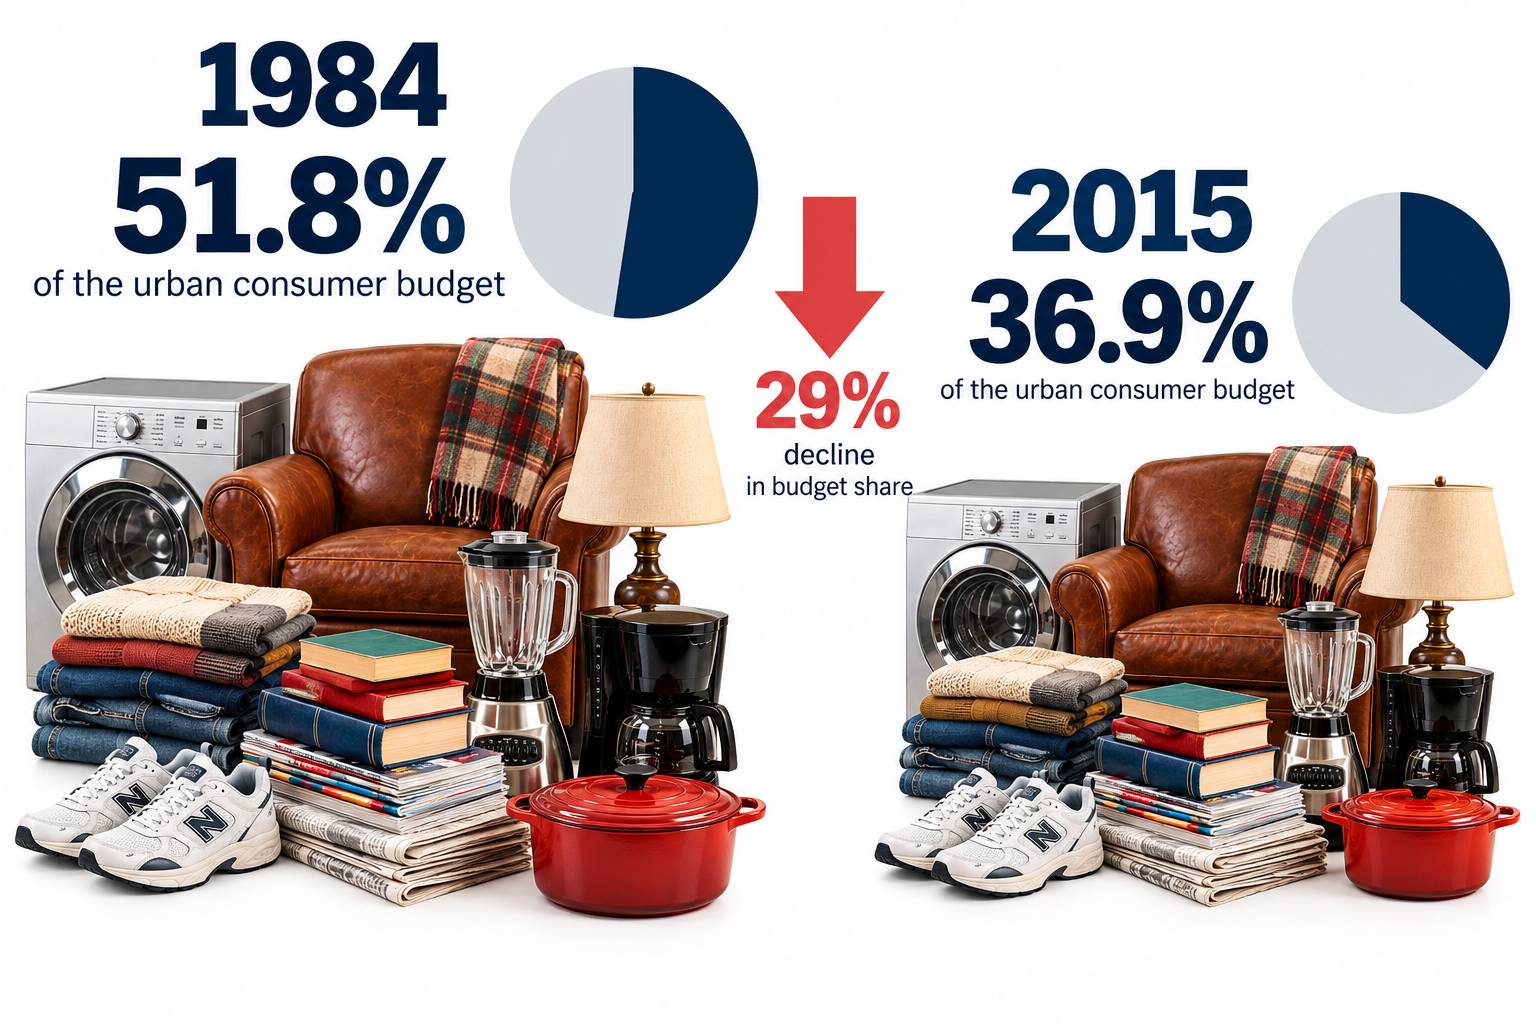
In 1984, physical commodities accounted for about 51.8% of the urban consumer budget. By 2015, that share had fallen to 36.9% as Americans shifted more of their spending toward services.
17. Residential Landline Phone Service
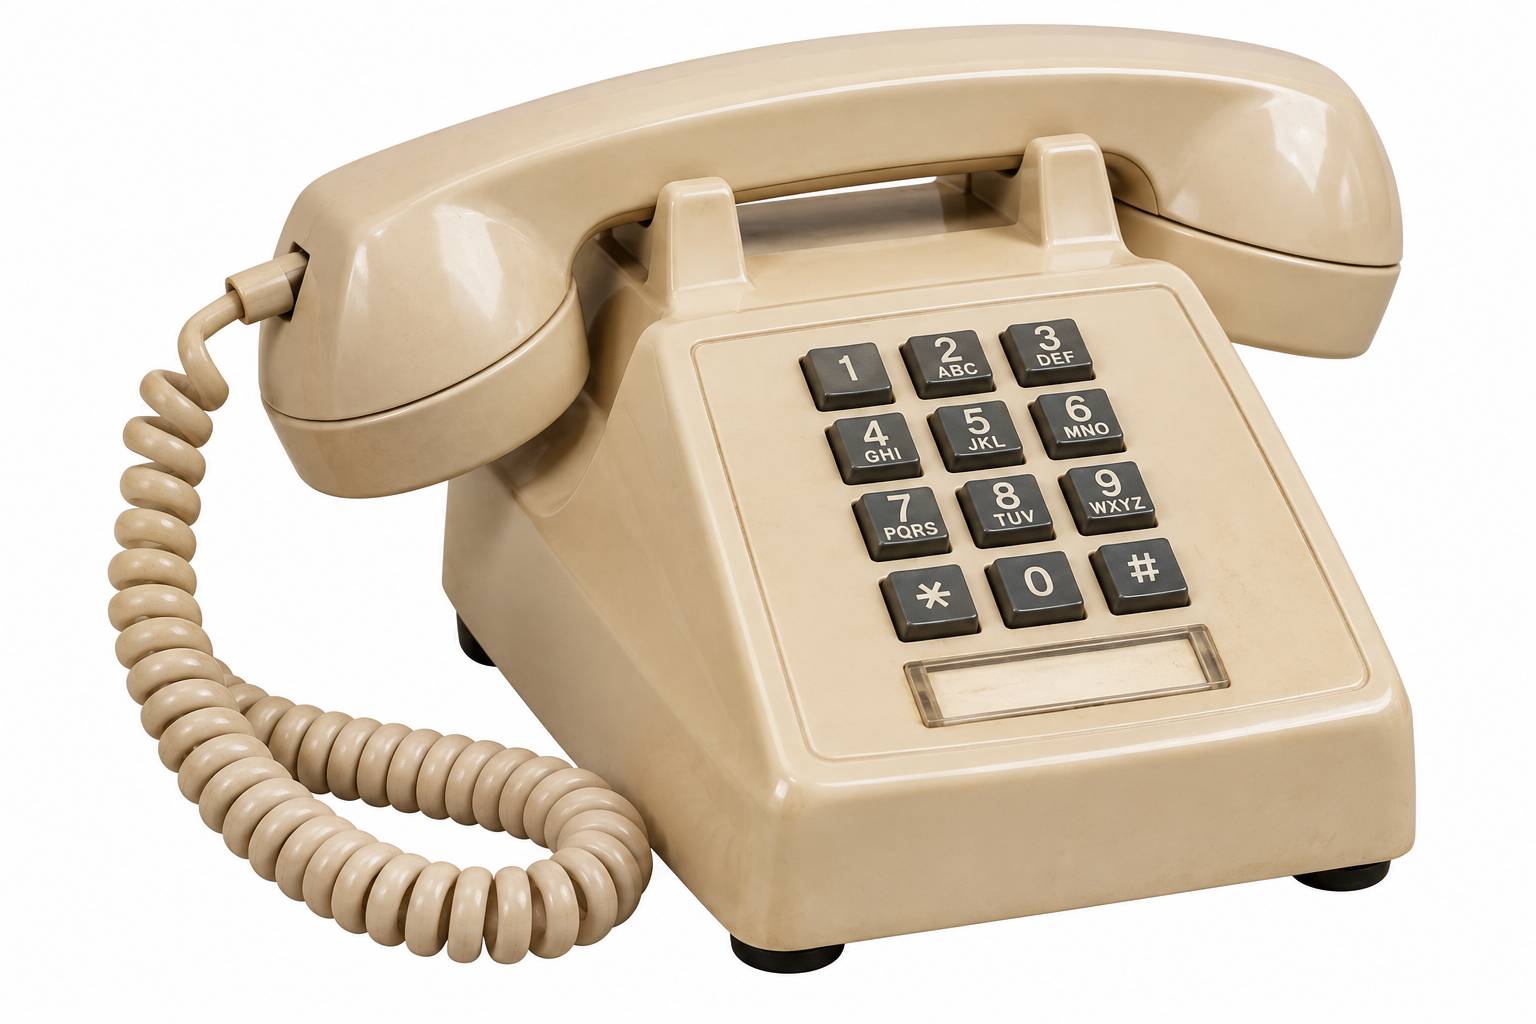
Landline service provides a dramatic example where actual spending declined, not merely its budget share. In 2001, the average consumer unit spent about $686 annually on residential landline service.
You might also like:
• 15 Things the Average Family Could Afford in 1980 but Struggles With Today